Saturday, October 25, 2014

Giant Sunspot Erupts with 4th Substantial Flare


The sun emitted a significant solar flare, peaking at 5:40 p.m. EDT on Oct. 24, 2014. NASA's Solar Dynamics Observatory, which watches the sun constantly, captured images of the event. Solar flares are powerful bursts of radiation. Harmful radiation from a flare cannot pass through Earth's atmosphere to physically affect humans on the ground, however -- when intense enough -- they can disturb the atmosphere in the layer where GPS and communications signals travel. This flare is classified as an X3.1-class flare. X-class denotes the most intense flares, while the number provides more information about its strength. An X2 is twice as intense as an X1, an X3 is three times as intense, etc. The flare erupted from a particularly large active region -- labeled AR 12192 -- on the sun that is the largest in 24 years. This is the fourth substantial flare from this active region since Oct. 19.


Active region AR 12192 on the sun erupted with a strong flare on Oct. 24, 2014, as seen in the bright light of this image captured by NASA's Solar Dynamics Observatory. This image shows extreme ultraviolet light that highlights the hot solar material in the sun's atmosphere. Credit: NASA/GSFC/SDO


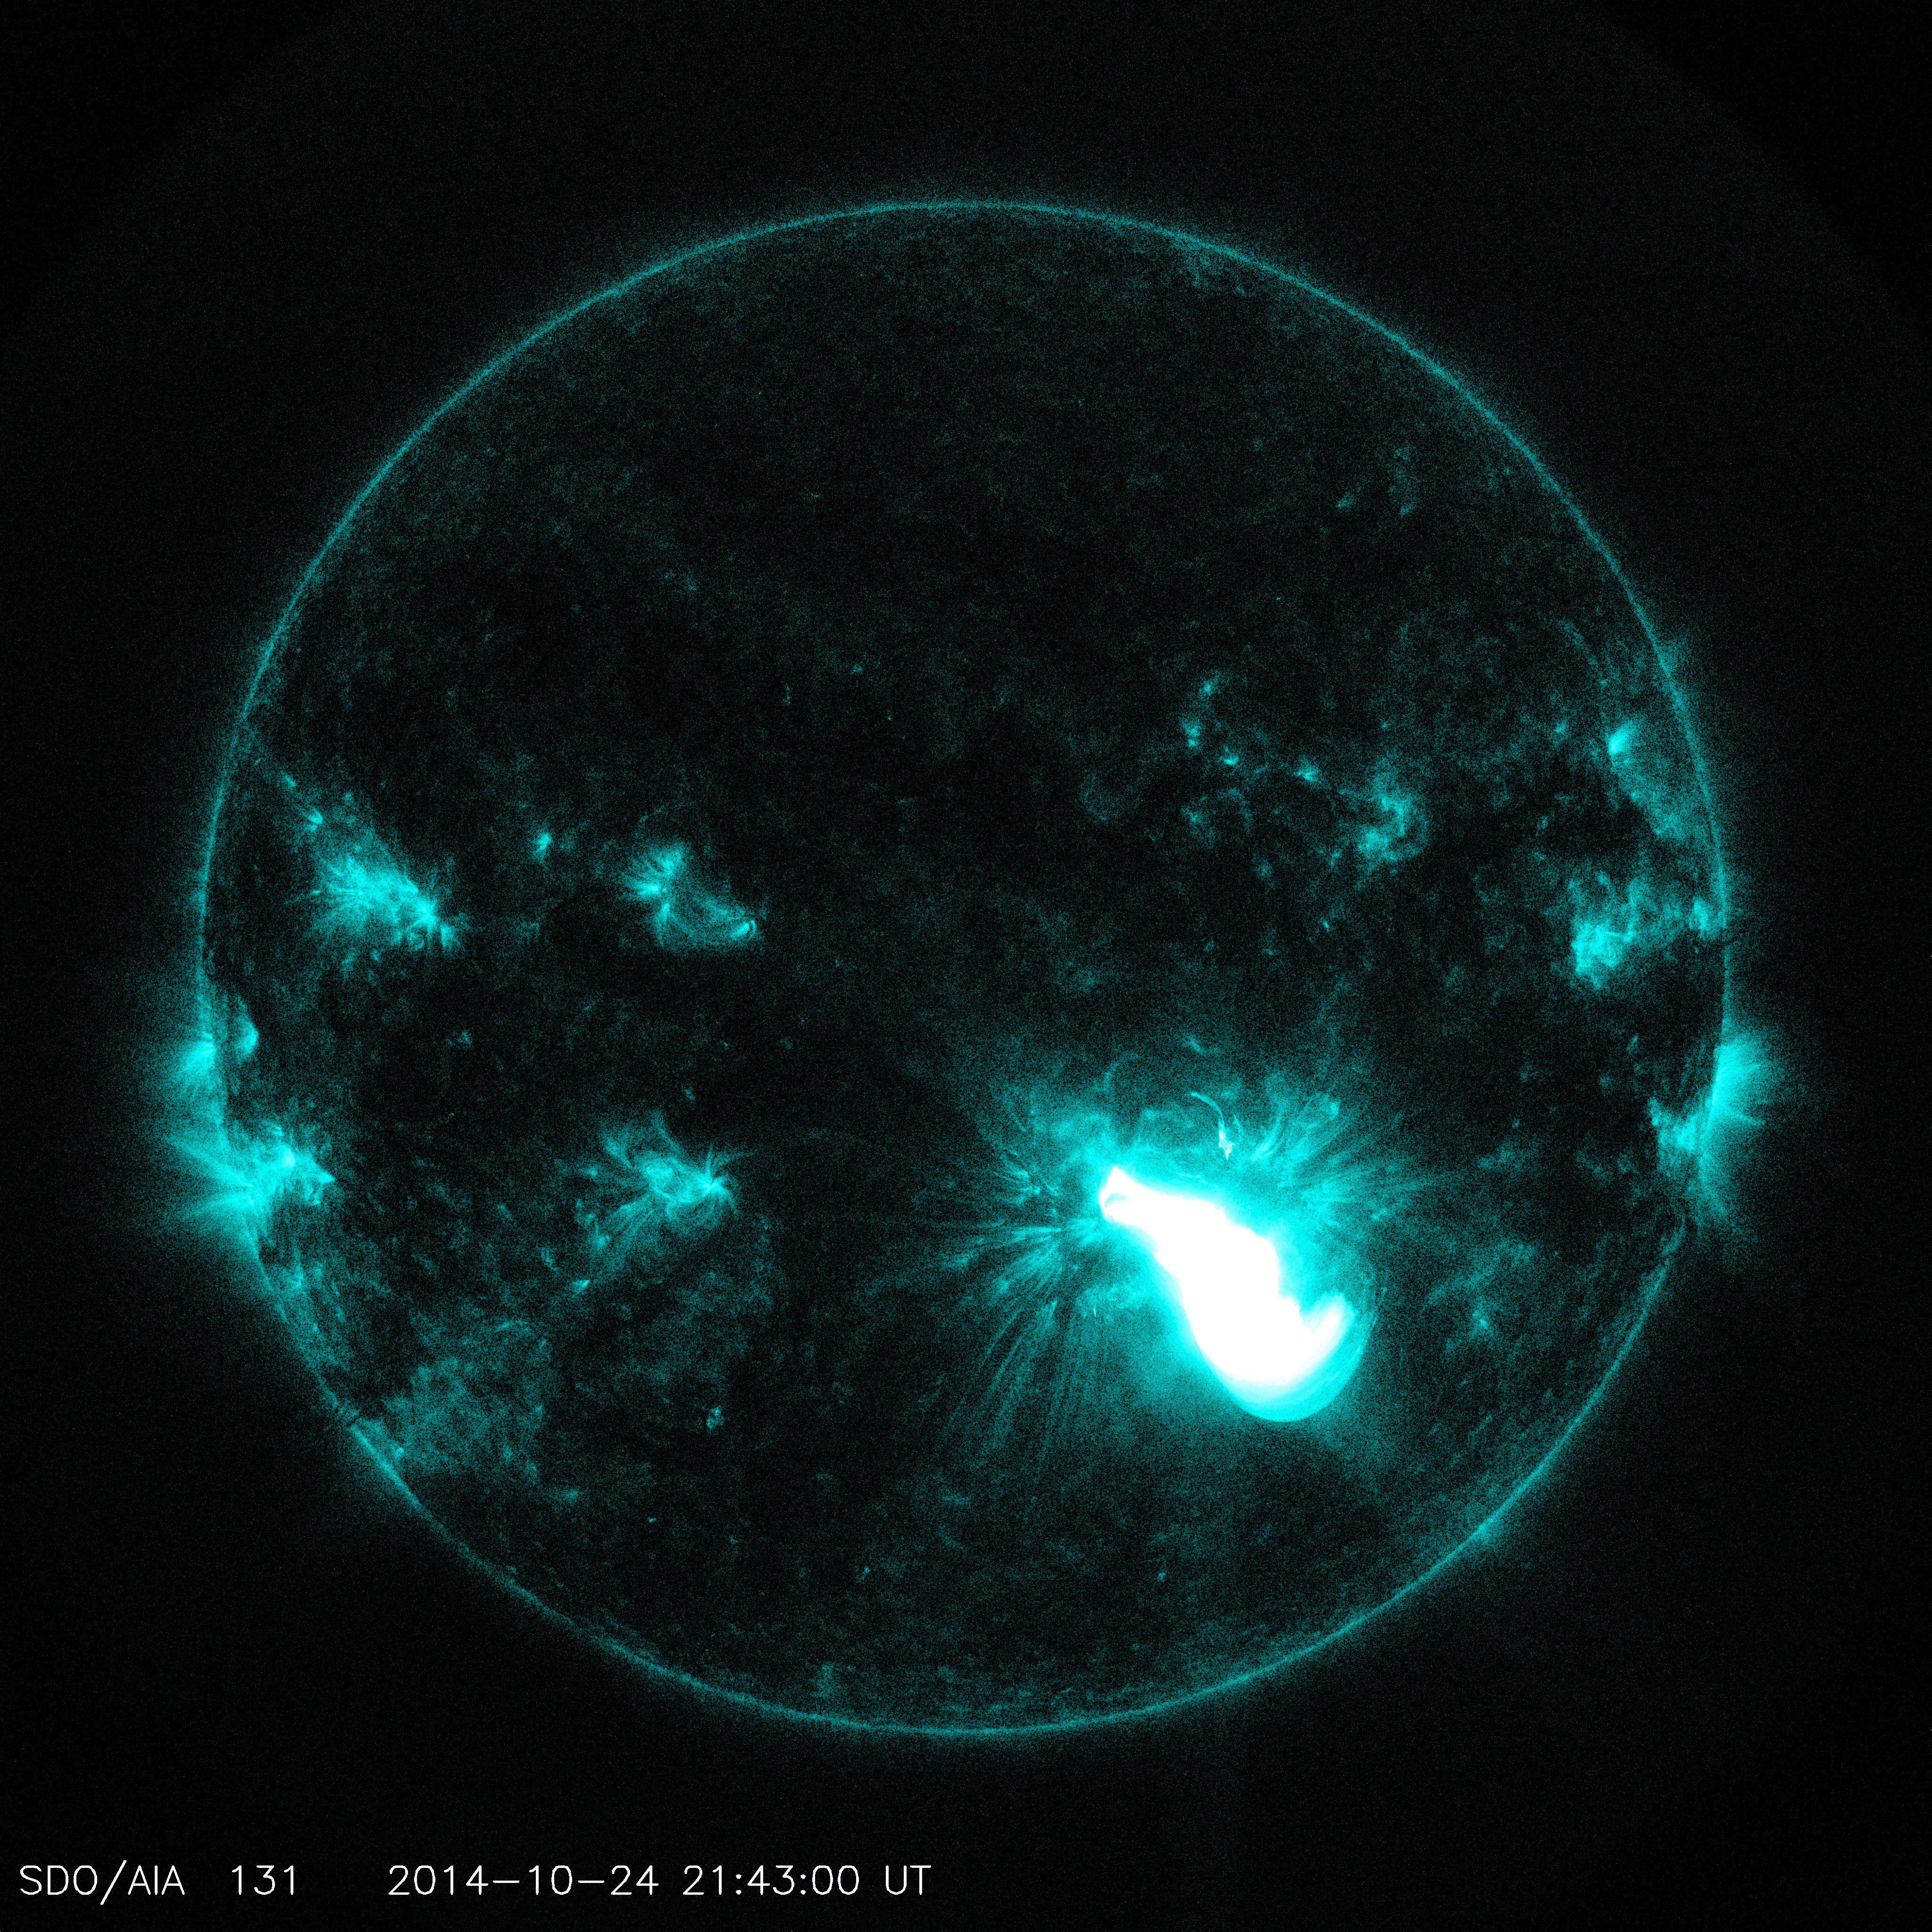
SDO AIA image of the X3.1 flare in 171 angstrom light from 21:41 UT on October 24, 2014. Credit:NASA/SDO

Giant Sunspot Erupts with 4th Substantial Flare


The sun emitted a significant solar flare, peaking at 5:40 p.m. EDT on Oct. 24, 2014. NASA's Solar Dynamics Observatory, which watches the sun constantly, captured images of the event. Solar flares are powerful bursts of radiation. Harmful radiation from a flare cannot pass through Earth's atmosphere to physically affect humans on the ground, however -- when intense enough -- they can disturb the atmosphere in the layer where GPS and communications signals travel. To see how this event may affect Earth, please visit NOAA's Space Weather Prediction Center at http://spaceweather.gov, the U.S. government's official source for space weather forecasts, alerts, watches and warnings.


An X3.2-class flare erupted from the lower half of the sun on Oct. 24, 2014. This image of the flare was captured by NASA's SDO and it shows extreme ultraviolet light in the 304 Angstrom wavelength. Image Credit: NASA/SDO This flare is classified as an X3.1-class flare. X-class denotes the most intense flares, while the number provides more information about its strength. An X2 is twice as intense as an X1, an X3 is three times as intense, etc. The flare erupted from a particularly large active region -- labeled AR 12192 -- on the sun that is the largest in 24 years. This is the fourth substantial flare from this active region since Oct. 19.

source : http://www.nasa.gov/content/goddard/giant-sunspot-erupts-with-4th-substantial-flare/#.VEvOwfnF8d0

Friday, October 24, 2014

NASA Identifies Ice Cloud Above Cruising Altitude on Titan


NASA scientists have identified an unexpected high-altitude methane ice cloud on Saturn's moon Titan that is similar to exotic clouds found far above Earth's poles. This lofty cloud, imaged by NASA's Cassini spacecraft, was part of the winter cap of condensation over Titan's north pole. Now, eight years after spotting this mysterious bit of atmospheric fluff, researchers have determined that it contains methane ice, which produces a much denser cloud than the ethane ice previously identified there. "The idea that methane clouds could form this high on Titan is completely new," said Carrie Anderson, a Cassini participating scientist at NASA's Goddard Space Flight Center in Greenbelt, Maryland, and lead author of the study. "Nobody considered that possible before."


Methane clouds were already known to exist in Titan's troposphere, the lowest layer of the atmosphere. Like rain and snow clouds on Earth, those clouds form through a cycle of evaporation and condensation, with vapor rising from the surface, encountering cooler and cooler temperatures and falling back down as precipitation. On Titan, however, the vapor at work is methane instead of water. The newly identified cloud instead developed in the stratosphere, the layer above the troposphere. Earth has its own polar stratospheric clouds, which typically form above the North Pole and South Pole between 49,000 and 82,000 feet (15 to 25 kilometers) -- well above cruising altitude for airplanes. These rare clouds don't form until the temperature drops to minus 108 degrees Fahrenheit (minus 78 degrees Celsius). Other stratospheric clouds had been identified on Titan already, including a very thin, diffuse cloud of ethane, a chemical formed after methane breaks down. Delicate clouds made from cyanoacetylene and hydrogen cyanide, which form from reactions of methane byproducts with nitrogen molecules, also have been found there. But methane clouds were thought unlikely in Titan's stratosphere. Because the troposphere traps most of the moisture, stratospheric clouds require extreme cold. Even the stratosphere temperature of minus 333 degrees Fahrenheit (minus 203 degrees Celsius), observed by Cassini just south of the equator, was not frigid enough to allow the scant methane in this region of the atmosphere to condense into ice. What Anderson and her Goddard co-author, Robert Samuelson, noted is that temperatures in Titan's lower stratosphere are not the same at all latitudes. Data from Cassini's Composite Infrared Spectrometer and the spacecraft's radio science instrument showed that the high-altitude temperature near the north pole was much colder than that just south of the equator. It turns out that this temperature difference -- as much as 11 degrees Fahrenheit (minus 12 degrees Celsius) -- is more than enough to yield methane ice. Other factors support the methane identification. Initial observations of the cloud system were consistent with small particles composed of ethane ice. Later observations revealed some regions to be clumpier and denser, suggesting that more than one ice could be present. The team confirmed that the larger particles are the right size for methane ice and that the expected amount of methane -- one-and-a-half percent, which is enough to form ice particles -- is present in the lower polar stratosphere. The mechanism for forming these high-altitude clouds appears to be different from what happens in the troposphere. Titan has a global circulation pattern in which warm air in the summer hemisphere wells up from the surface and enters the stratosphere, slowly making its way to the winter pole. There, the air mass sinks back down, cooling as it descends, which allows the stratospheric methane clouds to form. "Cassini has been steadily gathering evidence of this global circulation pattern, and the identification of this new methane cloud is another strong indicator that the process works the way we think it does," said Michael Flasar, Goddard scientist and principal investigator for Cassini's Composite Infrared Spectrometer (CIRS). Like Earth's stratospheric clouds, this methane cloud was located near the winter pole, above 65 degrees north latitude. Anderson and Samuelson estimate that this type of cloud system -- which they call subsidence-induced methane clouds, or SIMCs for short -- could develop between 98,000 to 164,000 feet (30 to 50 kilometers) in altitude above Titan's surface. "Titan continues to amaze with natural processes similar to those on the Earth, yet involving materials different from our familiar water," said Scott Edgington, Cassini deputy project scientist at NASA's Jet Propulsion Laboratory (JPL) in Pasadena, California. "As we approach southern winter solstice on Titan, we will further explore how these cloud formation processes might vary with season."

NASA Begins Sixth Year of Airborne Antarctic Ice Change Study


NASA’s DC-8 research aircraft will be flying scientists and instruments over Antarctica to study changes in the continent’s ice sheet, glaciers and sea ice. Image Credit: NASA

NASA is carrying out its sixth consecutive year of Operation IceBridge research flights over Antarctica to study changes in the continent’s ice sheet, glaciers and sea ice. This year’s airborne campaign, which began its first flight Thursday morning, will revisit a section of the Antarctic ice sheet that recently was found to be in irreversible decline. For the next several weeks, researchers will fly aboard NASA’s DC-8 research aircraft out of Punta Arenas, Chile. This year also marks the return to western Antarctica following 2013’s campaign based at the National Science Foundation’s McMurdo Station. “We are curious to see how much these glaciers have changed in two years,” said Eric Rignot, IceBridge science team co-lead and glaciologist at the University of California, Irvine and NASA’s Jet Propulsion Laboratory (JPL) in Pasadena, California. IceBridge will use a suite of instruments that includes a laser altimeter, radar instruments, cameras, and a gravimeter, which is an instrument that detects small changes in gravity. These small changes reveal how much mass these glaciers have lost. Repeated annual measurements of key glaciers maintains a long-term record of change in the Antarctic that goes back to NASA’s Ice, Cloud and Land Elevation Satellite (ICESat) which stopped collecting data in 2009. IceBridge researchers plan to measure previously unsurveyed regions of Antarctica. One example is a plan to look at the upper portions of Smith Glacier in West Antarctica, which is thinning faster than any other glaciers in the region. The mission also plans to collect data in portions of the Antarctic Peninsula, such as the Larsen C, George VI and Wilkins ice shelves and the glaciers that drain into them. The Antarctic Peninsula has been warming faster than the rest of the continent. “The Antarctic Peninsula is changing fairly rapidly and we need to be there to capture that change,” said Michael Studinger, IceBridge project scientist at NASA’s Goddard Space Flight Center in Greenbelt, Maryland. The mission also will collect data on Antarctic sea ice, which recently reached a record high coverage. This contrasts with declining sea ice in the Arctic and is due do a variety of factors such as changing wind patterns. Antarctic sea ice coverage is slightly above average and the growth varies from one part of Antarctica to another. For example, ice cover in the Bellingshausen Sea has been decreasing while ice in the nearby Ross Sea is growing. “There are very strong regional variations on how sea ice is changing,” said Nathan Kurtz, a sea ice scientist at Goddard. These regional trends together yield a small increase, so studying each region will help scientists get a better grasp on the processes affecting sea ice there. In addition to extending ICESat’s data record over land and sea ice, IceBridge will also help set the stage for ICESat-2 by measuring ice the satellite will fly over. One of IceBridge’s highest priority surveys is a circular flight the DC-8 will fly around the South Pole at 88 degrees south latitude. This latitude line is where all of ICESat-2’s orbits will converge in the Southern Hemisphere. Measuring ice elevation at these locations will help researchers build a time series of data that spans more than a decade and provide a way to help verify ICESat-2’s data. IceBridge’s Antarctic field campaign will run through late November. The IceBridge project science office is based at Goddard. The DC-8 research aircraft is based at NASA’s Armstrong Flight Research Center’s facility in Palmdale, California.

Watch a Solar Eclipse With Your Own Pinhole Camera


You don't need fancy glasses or equipment to watch one of the sky's most awesome shows: a solar eclipse. With just a few simple supplies, you can make a pinhole camera that lets you watch a solar eclipse safely and easily from anywhere. Before you get started, remember: You should never look at the sun directly, even with binoculars or a telescope, because you could severely damage your eyes or even go blind! Stay safe and still enjoy the sun's stellar shows by creating your very own pinhole camera. It's easy! Here's how:

What you'll need:

2 pieces of white card stock Aluminum foil Tape Pin or paper clip

What to do:

                                      
1. Cut a square hole into the middle of one of your pieces of card stock


2. Tape a piece of aluminum foil over the hole.
                                      

3. Use your pin or paper clip to poke a small hole in the aluminum foil.
                                      
4. Place your second piece of card stock on the ground and hold the piece with aluminum foil above it (foil facing up). Stand with the sun behind you and view the projected image on the card stock below! The farther away you hold it, the bigger your projected image will be. You can also try putting your bottom piece of card stock in a shadowed area while you hold the other piece in the sunlight to make your projection a bit more defined. Of course, pinhole cameras can get much fancier


source : http://www.jpl.nasa.gov/education/index.cfm?page=341

Close Encounters: Comet Siding Spring Seen Next to Mars

NASA’s Hubble Space Telescope has produced a unique composite image of comet Siding Spring as it made its never-before-seen close passage of a comet by Mars. Siding Spring, officially designated Comet C/2013 A1, made its closest approach to Mars at 2:28 p.m. EDT on Oct. 19, at a distance of approximately 87,000 miles. That is about one-third of the distance between Earth and the moon. At that time, the comet and Mars were about 149 million miles from Earth. The comet image is a composite of Hubble exposures taken between Oct. 18, 8:06 a.m. to Oct. 19, 11:17 p.m. Hubble took a separate image of Mars at 10:37 p.m. on Oct. 18. The Mars and comet images have been added together to create a single picture to illustrate the angular separation, or distance, between the comet and Mars at closest approach. The separation is approximately 1.5 arc minutes, or one-twentieth of the angular diameter of the full moon. The background star field in this composite image is synthesized from ground-based telescope data provided by the Palomar Digital Sky Survey, which has been reprocessed to approximate Hubble’s resolution. The solid icy comet nucleus is too small to be resolved in the Hubble picture. The comet’s bright coma, a diffuse cloud of dust enshrouding the nucleus, and a dusty tail, are clearly visible. This is a composite image because a single exposure of the stellar background, comet Siding Spring, and Mars would be problematic. Mars actually is 10,000 times brighter than the comet, so it could not be properly exposed to show detail in the Red Planet. The comet and Mars also were moving with respect to each other and could not be imaged simultaneously in one exposure without one of the objects being motion blurred. Hubble had to be programmed to track on the comet and Mars separately in two different observations. NASA used its extensive fleet of science assets, particularly those orbiting and roving Mars, to image and study this once-in-a-lifetime comet flyby. In preparation for the comet flyby, NASA maneuvered its Mars Odyssey orbiter, Mars Reconnaissance Orbiter (MRO), and the newest member of the Mars fleet, Mars Atmosphere and Volatile EvolutioN (MAVEN), in order to reduce the risk of impact with high-velocity dust particles coming off the comet. Other NASA space observatories also joined Hubble in observing the encounter, along with ground-based telescopes on Earth. Siding Spring is the first comet from our solar system’s Oort Cloud to be studied up close. The Oort Cloud, well beyond the outer-most planets that surround our sun, is a spherical region of icy objects believed to be material left over from the formation of the solar system. The new composite image was taken with Hubble’s Wide Field Camera 3. To view the image, visit:

Galactic Wheel of Life Shines in Infrared | October 22, 2014


It might look like a spoked wheel or even a "Chakram" weapon wielded by warriors like "Xena," from the fictional TV show, but this ringed galaxy is actually a vast place of stellar life. A newly released image from NASA's Spitzer Space Telescope shows the galaxy NGC 1291. Though the galaxy is quite old, roughly 12 billion years, it is marked by an unusual ring where newborn stars are igniting.
"The rest of the galaxy is done maturing," said Kartik Sheth of the National Radio Astronomy Observatory of Charlottesville, Virginia. "But the outer ring is just now starting to light up with stars."
NGC 1291 is located about 33 million light-years away in the constellation Eridanus. It is what's known as a barred galaxy, because its central region is dominated by a long bar of stars (in the new image, the bar is within the blue circle and looks like the letter "S").
The bar formed early in the history of the galaxy. It churns material around, forcing stars and gas from their original circular orbits into large, non-circular, radial orbits. This creates resonances -- areas where gas is compressed and triggered to form new stars. Our own Milky Way galaxy has a bar, though not as prominent as the one in NGC 1291.
Sheth and his colleagues are busy trying to better understand how bars of stars like these shape the destinies of galaxies. In a program called Spitzer Survey of Stellar Structure in Galaxies, or S4G, Sheth and his team of scientists are analyzing the structures of more than 3,000 galaxies in our local neighborhood. The farthest galaxy of the bunch lies about 120 million light-years away -- practically a stone’s throw in comparison to the vastness of space.
The astronomers are documenting structural features, including bars. They want to know how many of the local galaxies have bars, as well as the environmental conditions in a galaxy that might influence the formation and structure of bars.
"Now, with Spitzer we can measure the precise shape and distribution of matter within the bar structures," said Sheth. "The bars are a natural product of cosmic evolution, and they are part of the galaxies' endoskeleton. Examining this endoskeleton for the fossilized clues to their past gives us a unique view of their evolution."
In the Spitzer image, shorter-wavelength infrared light has been assigned the color blue, and longer-wavelength light, red. The stars that appear blue in the central, bulge region of the galaxy are older; most of the gas, or star-making fuel, there was previously used up by earlier generations of stars. When galaxies are young and gas-rich, stellar bars drive gas toward the center, feeding star formation
Over time, as the fuel runs out, the central regions become quiescent and star-formation activity shifts to the outskirts of a galaxy. There, spiral density waves and resonances induced by the central bar help convert gas to stars. The outer ring, seen here in red, is one such resonance area, where gas has been trapped and ignited into star-forming frenzy.
NASA's Jet Propulsion Laboratory, Pasadena, California, manages the Spitzer Space Telescope mission for NASA's Science Mission Directorate, Washington. Science operations are conducted at the Spitzer Science Center at the California Institute of Technology in Pasadena. Spacecraft operations are based at Lockheed Martin Space Systems Company, Littleton, Colorado. Data are archived at the Infrared Science Archive housed at the Infrared Processing and Analysis Center at Caltech. Caltech manages JPL for NASA. For more information about Spitzer, visit:
and